An analysis of 365,920 fanout queries from Google, OpenAI, and Amazon reveals how different AI models generate internal search queries for web grounding.
When you ask an AI model like Gemini, GPT, or Nova to search the web, it does not just run your prompt as-is. Instead, it breaks down your question, explores subtopics, and verifies information by generating its own internal search queries. These are known as fanout queries, and a single user prompt can trigger several of them.
By analyzing over three hundred and sixty thousand of these background queries from real production workloads, we can see exactly how the major AI providers differ in how they search.
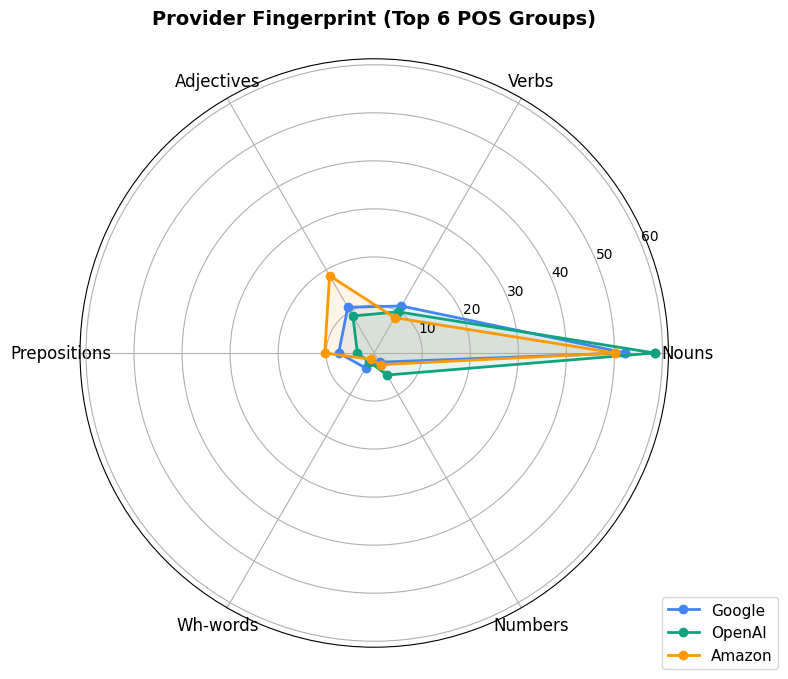
Google tends to generate searches that sound like natural questions. Its queries use more verbs and inquiry words like "how," "what," and "which" to find information.
OpenAI takes a different approach. Its queries focus heavily on nouns, particularly proper nouns. It searches for specific entities, and it uses twice as many numbers as the other models, likely looking for specific years and quantities.
Amazon leans into description. Its model uses significantly more adjectives, crafting queries with qualifying terms like "best," "top," or "most effective."
So, while we only see a single final answer, these models are busy behind the scenes, each using its own unique search strategy to track down the facts.
When AI models like Gemini, GPT or Nova answer a question using web search, they don’t just run your query as-is. They generate their own internal search queries, or fanout queries. A single user prompt can trigger multiple fanout queries as the model breaks down the question, explores subtopics and verifies information.

We captured 365,920 of these fanout queries across three providers, Google (Gemini), OpenAI (GPT) and Amazon (Nova), by logging the grounding metadata returned from their APIs during citation mining runs. This data comes from real production workloads across multiple projects, not synthetic benchmarks.
Below is an analysis of how these providers differ in the queries they generate.
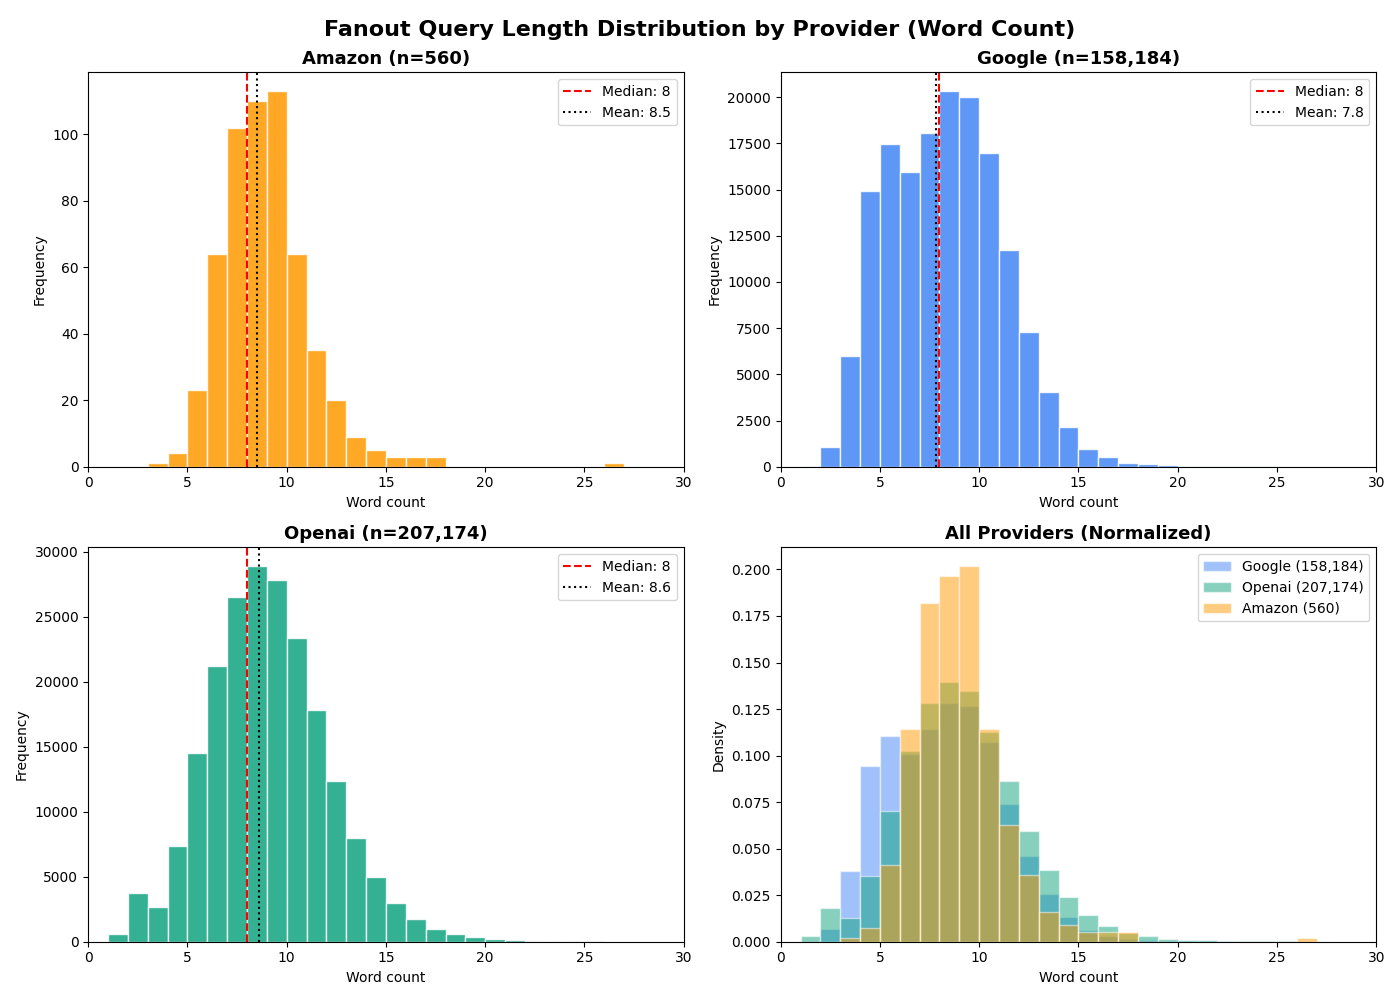
ProviderCountAvg CharsMinMax1-3 words4-6 words7+ wordsGoogle158,1865202524.5%30.6%64.9%OpenAI207,1746063233.4%20.8%75.8%Amazon56059281980.2%16.2%83.6%Total~365,9205603233.9%25.0%71.1%Google (n=158,184)
WordsCount%Cumul%1530.0%0.0%21,0920.7%0.7%35,9943.8%4.5%414,9169.4%13.9%517,47111.0%25.0%615,92310.1%35.1%718,08011.4%46.5%820,32512.8%59.3%920,01312.7%72.0%1016,96810.7%82.7%1111,7407.4%90.1%127,3164.6%94.8%134,0432.6%97.3%142,1241.3%98.7%15+1,1460.7%100.0%OpenAI (n=207,174)
WordsCount%Cumul%16160.3%0.3%23,7151.8%2.1%32,6911.3%3.4%47,3603.6%6.9%514,5167.0%13.9%621,22110.2%24.2%726,54412.8%37.0%828,91214.0%51.0%927,86113.4%64.4%1023,35411.3%75.7%1117,8758.6%84.3%1212,3396.0%90.3%137,9833.9%94.1%144,9592.4%96.5%15+5,2282.5%100.0%Amazon (n=560)
WordsCount%Cumul%310.2%0.2%440.7%0.9%5234.1%5.0%66411.4%16.4%710218.2%34.6%811019.6%54.3%911320.2%74.5%106411.4%85.9%11356.2%92.1%12203.6%95.7%1391.6%97.3%1450.9%98.2%15+101.8%100.0%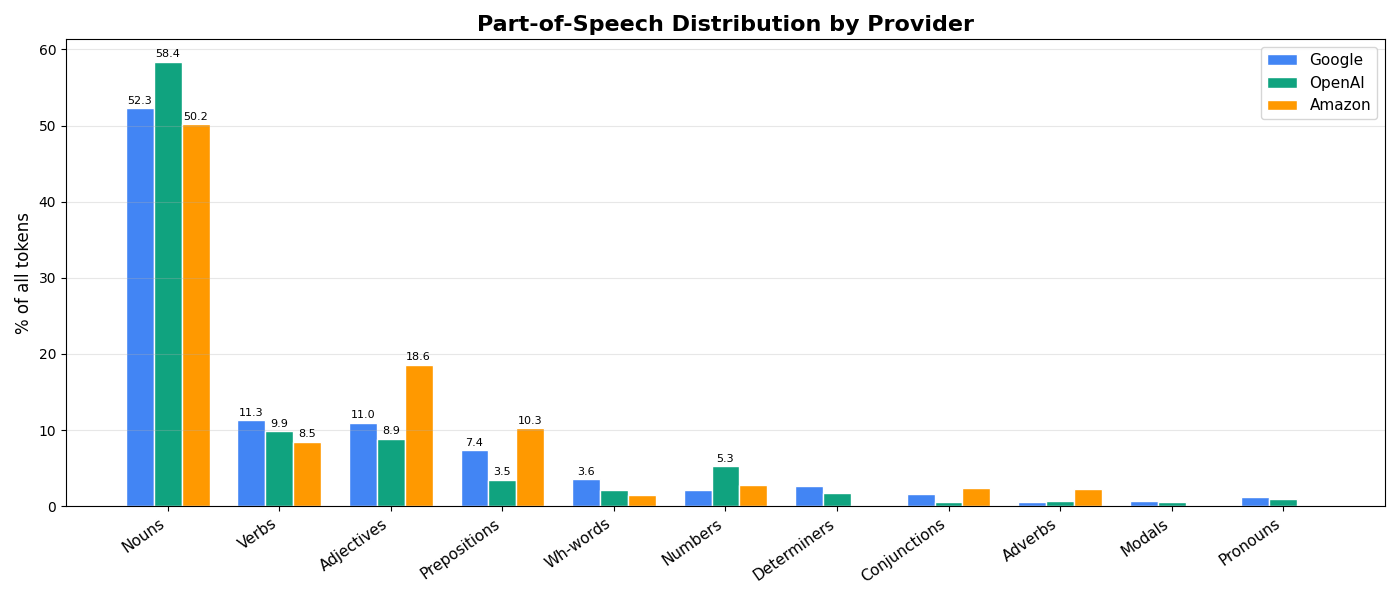
 Dan Petrovic ·
Mar 20, 11:58
Dan Petrovic ·
Mar 20, 11:58
Sign in with Google to comment.